Determining the best number of fitting points for MSD data
First published:
Last Edited:
Number of edits:
source: [
@ernst2013
Measuring a diffusion coefficient by single-particle tracking: statistical analysis of experimental mean squared displacement curves
]
To measure the diffusion coefficient, we can fit the mean squared displacement curve with the following equation:
Where
is the generalized diffusion coefficient, and
depends on the diffusive process (
normal brownian,
superdiffusive,
subdifussive).
Experimentally, the accuracy of the MSD is limited, as well as the maximum
possible. Therefore, it is valid to ask the question of what is the best approach to fit the data in order to extract the most accurate diffusion coefficient.
Considering more points does not necessarily improve the quality of the fit: the first few
values are the result of the average over a large number of measurements, while the larger time delays are averaged only a couple of times.
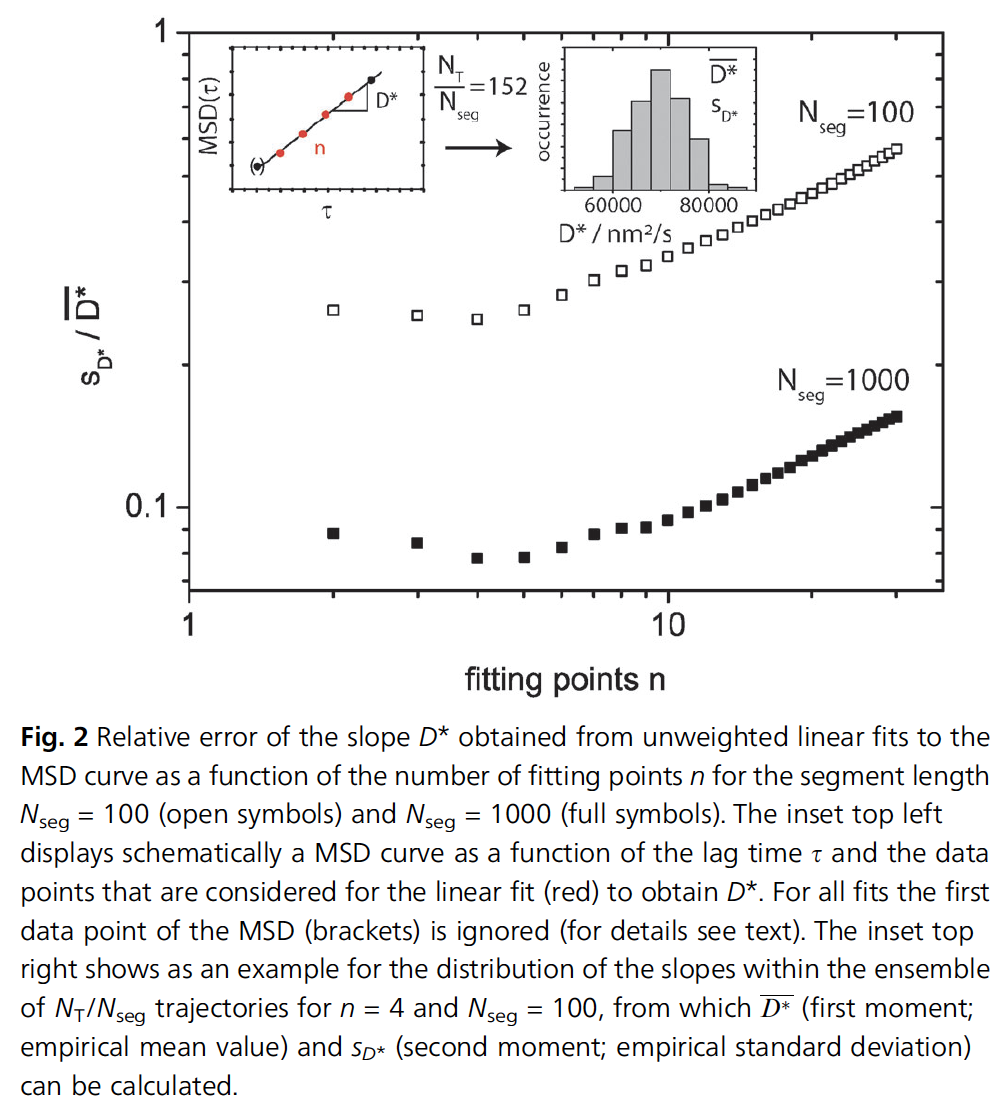
In a setting where a single-particle is tracked over
time-points, it is possible to divide the trajectory into different sub-sets and analyze how much the analysis changes compared to the analysis of the entire trajectory (presumably the most accurate one).
The figure above shows that using tracks of either
or
points, the error in the determination of
goes down initially, but after 4 or 5 fitting points, it increases dramatically. This means that the determination of the diffusion coefficient is best when using 4 or 5 points of
and not the entire dataset.
Join my experiment of better thinking and interesting discussions
Aquiles Carattino
This note you are reading is part
of my digital garden. Follow the
links to learn more, and remember that these notes evolve over time. After all,
this website is not a
blog.